
|
Outliner |
|
An outliner is an interactive hierarchical display of an object’s properties and elements. An outliner may appear as Best view of an explorer or by itself as a separate view.
The display is in two columns: the name of an element or property, and the value of that element or property.
Triangles
Any line in an outliner whose value is itself an object with elements and properties is indicated by a triangle. Click a triangle to reveal or hide the elements and properties of that object. (Alternatively, select a line containing a triangle and press Right Arrow or Left Arrow.) The chief cases of values with triangles are:
-
An element collection. Element collections are displayed before properties, in boldface with a plural name. For example, in the Finder, a folder may have
items. The value is shown as the element count (e.g., “8 items”). -
An object with properties. For example, a date value has properties. In the Finder, an item’s
containeris a folder and has elements and properties. The value is a reference to the object, as provided by the owning application. -
A list or record. The value depends on a Dictionary preference, “Show contents of list and record values”: if checked, the value is a literal list similar to Source view; if unchecked, the value is shown as the item count (e.g., “list of 2 items”).
-
A script object. The most common case is the variables pane, which itself explores a script object (the script itself) and displays additional script objects such as
parentandAppleScript.
Element Collections
When you reveal the elements of a collection, there may be a short delay as Script Debugger gathers information about them. If there are many elements in a collection, Script Debugger may save time (and Apple events!) by ceasing to gather information about them beyond a certain number. For example, run this script and examine the Best outliner in the results pane:
tell application "Finder"
    tell home
        get folder "Library"
    end tell
end tell
If you click the triangle next to items, some items are shown initially, followed by a Show More Items button. The number of items shown initially in these situations is governed by a Dictionary preference, “Show n elements at a time.”
Elements of a collection are initially gathered with reference to some particular specifier. The default specifier is governed by a Dictionary preference, the “Access Elements by” pop-up menu. Your options are Index, ID, and Name. You can change the reference specifier for an element collection using the pop-up menu next to the collection’s name in the outliner.
If a reference specifier fails (because the scriptable application doesn’t respond to it), Script Debugger automatically falls back on a different specifier and displays an exclamation-mark icon (
). For example, the Finder doesn’t implement gathering a folder’s items by ID and has trouble with
item of listexpressions; Script Debugger works around this behind the scenes, and displays the exclamation mark.
The same pop-up menu next to the collection’s name can also be used to replace the collection displayed with a single element. Your choices are First, Middle, Last, and Any.
Reloading
Gathering outliner information can be expensive and time-consuming (it involves sending a lot of Apple events), so Script Debugger gathers information only when it has to:
-
When an outliner initially appears, only information visible within the pane or window is gathered.
-
When you scroll an outliner, revealed information is gathered if it hasn’t been gathered already.
-
When you expand a triangle, revealed information is gathered, up to the limit specified by “Show n elements at a time,” as described above; when you click the Show More button, more information is gathered.
Outliners connected with your script, such as the result pane and the variables pane, automatically refresh their visible contents when you run the script or step while debugging. Otherwise, an outliner is not live. If the situation in the target application changes, you can manually request that the outliner refresh itself. To do so:
- Select a line within the outliner and choose Dictionary > Reload (or choose Reload from a line’s contextual menu). The value of that line, and everything exposed that’s hierarchically deeper, will be gathered afresh.
You can also ask to reload the entire outliner. (But be careful, because this may cause Script Debugger to send the target application a lot of Apple events!) To do so:
- Hold Option and choose Dictionary > Reload (All Items). Or, choose Reload All from the contextual menu.
Navigating an Outliner
When it appears as the Best view of an explorer, a value outliner has a path widget, along with back and forth buttons. If you double-click any line within the outline, that line is hoisted so that the explorer is now exploring that value.
In a “partial explorer” (with no path widget or Best/Source/AEPrint button), double-clicking a line spawns off a separate explorer window.
The path widget displays a reference to what is being explored. When a value within an explorer is hoisted, the path widget appends a reference to that value. Thus, the path widget always displays a chain of references (equivalent to a nest of tell blocks) showing how you arrived at the value now being explored. The highlighted reference in the path widget is the one currently being explored.
The references in the path widget are buttons. To navigate back up the chain of references:
- Click a button to the left of the highlighted button in the path widget.
When you navigate up the chain of references using the path widget, the path widget continues to show the full chain, in case you want to navigate back down it again. To navigate back down the chain of references:
- Click a button to the right of the highlighted button in the path widget.
Script Debugger also remembers each explored object (the explorer history list). To explore again a previously explored object:
- Click the Back button, or choose Dictionary > Go Back.
After using the Back button, you can use the Forward button, or choose Dictionary > Go Forward, to move the other way through the history list.
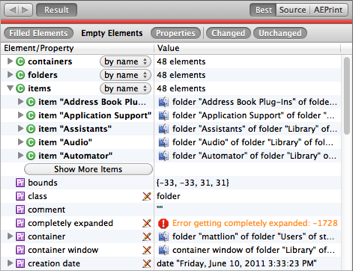
Filtering
You can filter the outline to show only certain attributes. To do so, use the buttons in the scope bar.
Your choices are:
-
Filled Elements. If highlighted (dark), element collections that actually contain elements are shown (element count is nonzero).
-
Empty Elements. If highlighted (dark), element collections that contain no actual elements are shown (element count is zero).
-
Properties. If highlighted (dark), properties are shown.
If both Filled Elements and Empty Elements are highlighted, all element collections are shown. If neither Filled Elements nor Empty Element are highlighted, no element collections are shown. If none of the above buttons are highlighted, the outliner will be empty!
To highlight all three of the above buttons quickly and show the complete outline, choose Show All Items, Properties & Elements from the contextual menu.
A second set of buttons lets you choose to show items with respect to recent changes in value:
-
Changed. If highlighted (dark), recently changed values are displayed (in red).
-
Unchanged. If highlighted (dark), the inverse set of values from Changed are displayed.
If neither Changed nor Unchanged is highlighted, the outliner will be empty!
The scope bar can be shown or hidden at will. Every explorer has a scope bar, including “partial explorers” like the variables pane and even the expressions pane; the scope bar is these partial explorers is hidden by default, to save space, but you can show it. To toggle the visibility of the scope bar:
- Choose Show/Hide Scope Bar from the contextual menu.
Dictionary
You can jump from a line of the outline to the dictionary entry for that term. To do so:
-
Control-click on the line of the outline and choose Show Definition from the contextual menu.
The definition for that class (or, if it’s a property, for the class of which this is a property) will be displayed in a dictionary window.
Raw (Chevron) Syntax
You can toggle between English terminology and raw Apple event codes in an outliner. To do so:
- Choose Show Raw (Chevron) Syntax from the contextual menu.
Badges
Names in an outliner are badged according to their type.
Object values in an outliner are badged with the icon of the owning application.
Read-only scalar values in an outliner are badged with a crossed-out pencil icon ().
Special Values
Error values (shown in orange, with a stop-sign icon) in an explorer are not problematic. They indicate that Script Debugger asked for an element or property and the application responded, in good order, with a runtime error. This is a valid response from the application.
A missing value result is also a valid response from the application.
An «empty» value is supplied by Script Debugger to indicate that the application has failed to return any value at all. This is useful information, because if you assign such a nonvalue to a variable in a script, that variable will be undefined.
In certain special cases, such as the entire contents property of the Finder, Script Debugger supplies a not loaded value so as not to request evaluation of a property whose value could take the application a very long time to return.
Editing in an Outliner
Read on to learn how you can edit a value or edit your script using an explorer’s outliner!