
|
Variables (Debug Mode) |
|
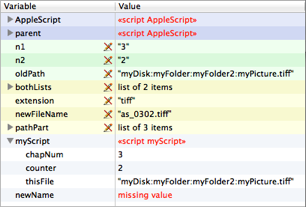
When a script is paused while debugging, the variables pane displays all variables currently in scope in the selected stack frame.
Important: This includes local variables — but local variables must be explicitly declared local (with a local statement), or they won’t be shown.
Variables are displayed in alphabetical order, grouped into the following categories:
-
Inherited variables (blue background).
A script’s persistent variables include those acquired through AppleScript’s script object inheritance mechanism.
By default, a script’s parent is the AppleScript scripting component. Therefore, the variables pane will usually display this object and its variables twice — once by virtue of being the script’s parent, and again by virtue of being the global script object
AppleScript. -
Local parameters (green background). These are incoming parameter values, and are shown if the currently selected stack frame is a handler with parameters.
-
Local variables (yellow background). These are local to the currently selected stack frame. You probably won’t see these unless you explicitly declare your locals.
-
Top-level entities.
The variables pane is an outliner, with all that this entails.
The ability to edit a variable value is especially useful when paused while debugging, because you can experiment with a different value after the pause than arrived before the pause, altering the behavior of your script as it proceeds to the next line.
Another way to see variable values is through tooltips that appear when you hover the mouse over an expression in your script. An Execution preference, “Show expression tooltips,” sets the conditions under which these appear.